Monitoring files activity with Splunk
Overview
Splunk is a powerful tool that allows users to analyze logs from different types of sources. Resilio Connect is no exception. For the rest of article we assume that the Splunk server resides on the same host as your Resilio MC, though technically Splunk can forward logs to another host, if necessary.
Warning
Only Resilio Connect MC v2.2 and newer events.log is compatible with Splunk. Starting from v2.9, you need to manually enable events.log.
Configure Splunk
-
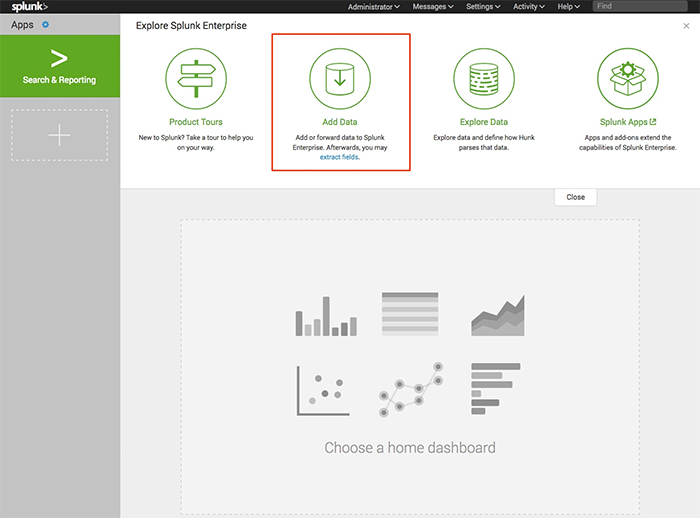
Open your Splunk admin console and choose Add data.
-
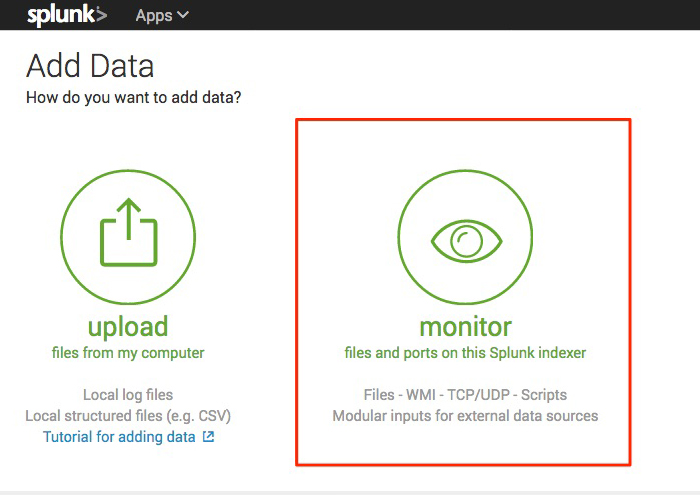
On the "Add Data" view, click Monitor.
-
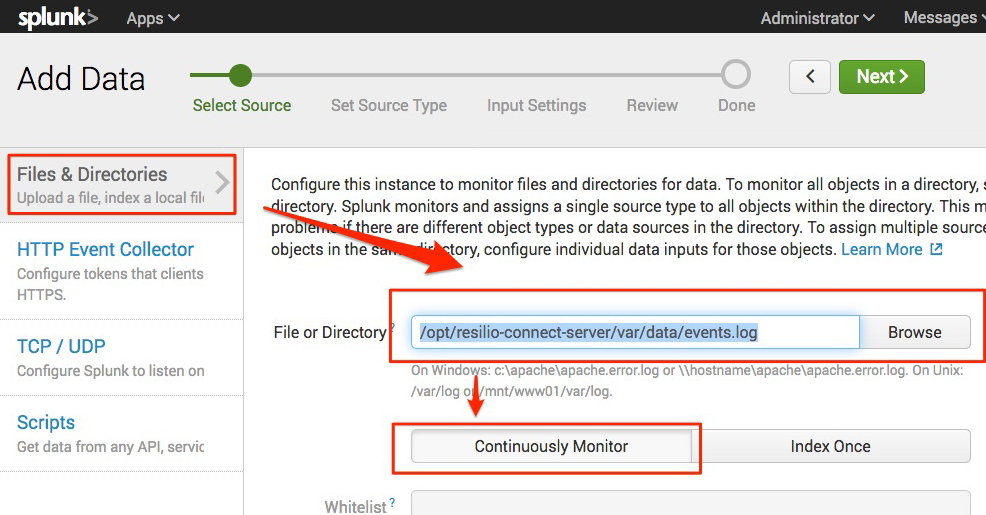
Select "Files & Directories" source and guide Splunk to the
events.logfile. The exact location depends on your OS and can be found in the server configuration file.Confirm that you need to continuously monitor the file.
-
Define events parsing:
- From the Source type drop-down list, select "Structured: _json".
- Choose Advanced extraction.
-
Select your timezone.
Note
This is essential as the MC stores all the data in the UTC timezone.
-
In the Timestamp format field, enter
%s, which informs Splunk that the time is stored in UNIXTIME format. -
In the Timestamp fields field, enter
event.tsto inform Splunk which JSON field contains the timestamp.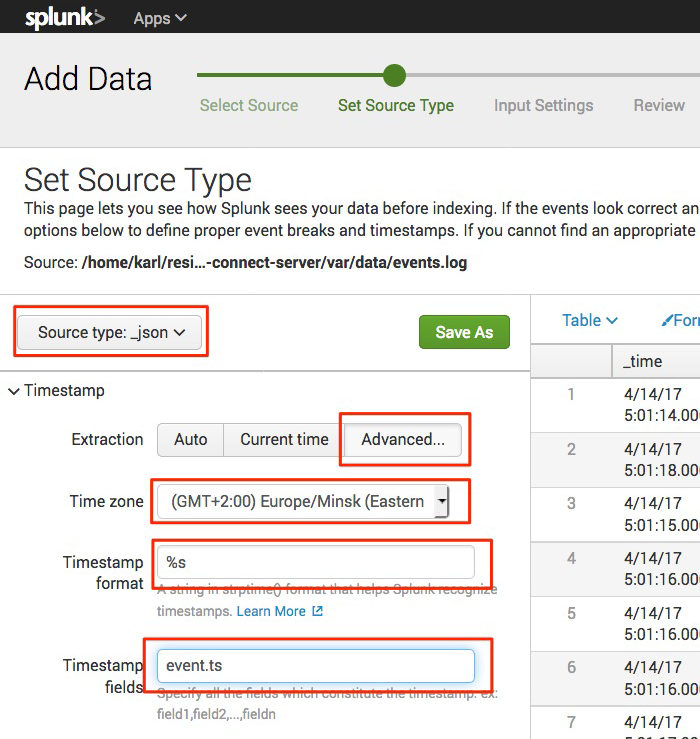
-
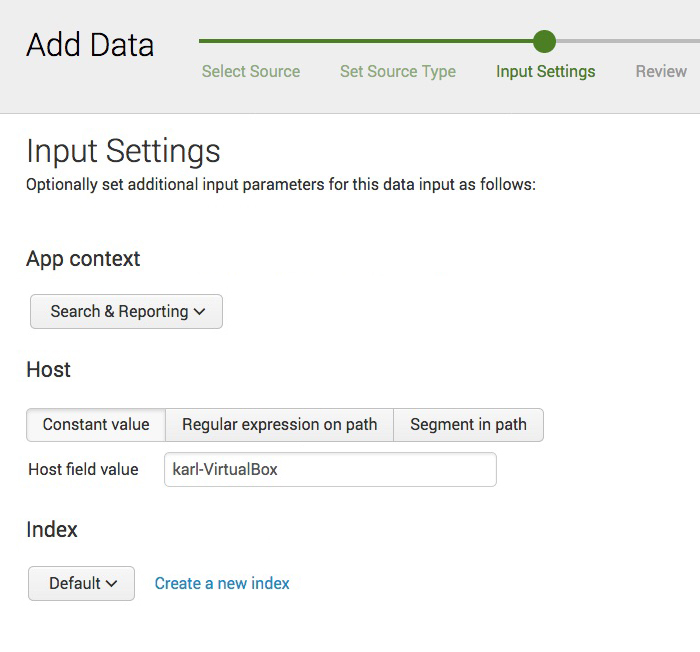
On the Input Settings, leave the default values and proceed to next step.
-
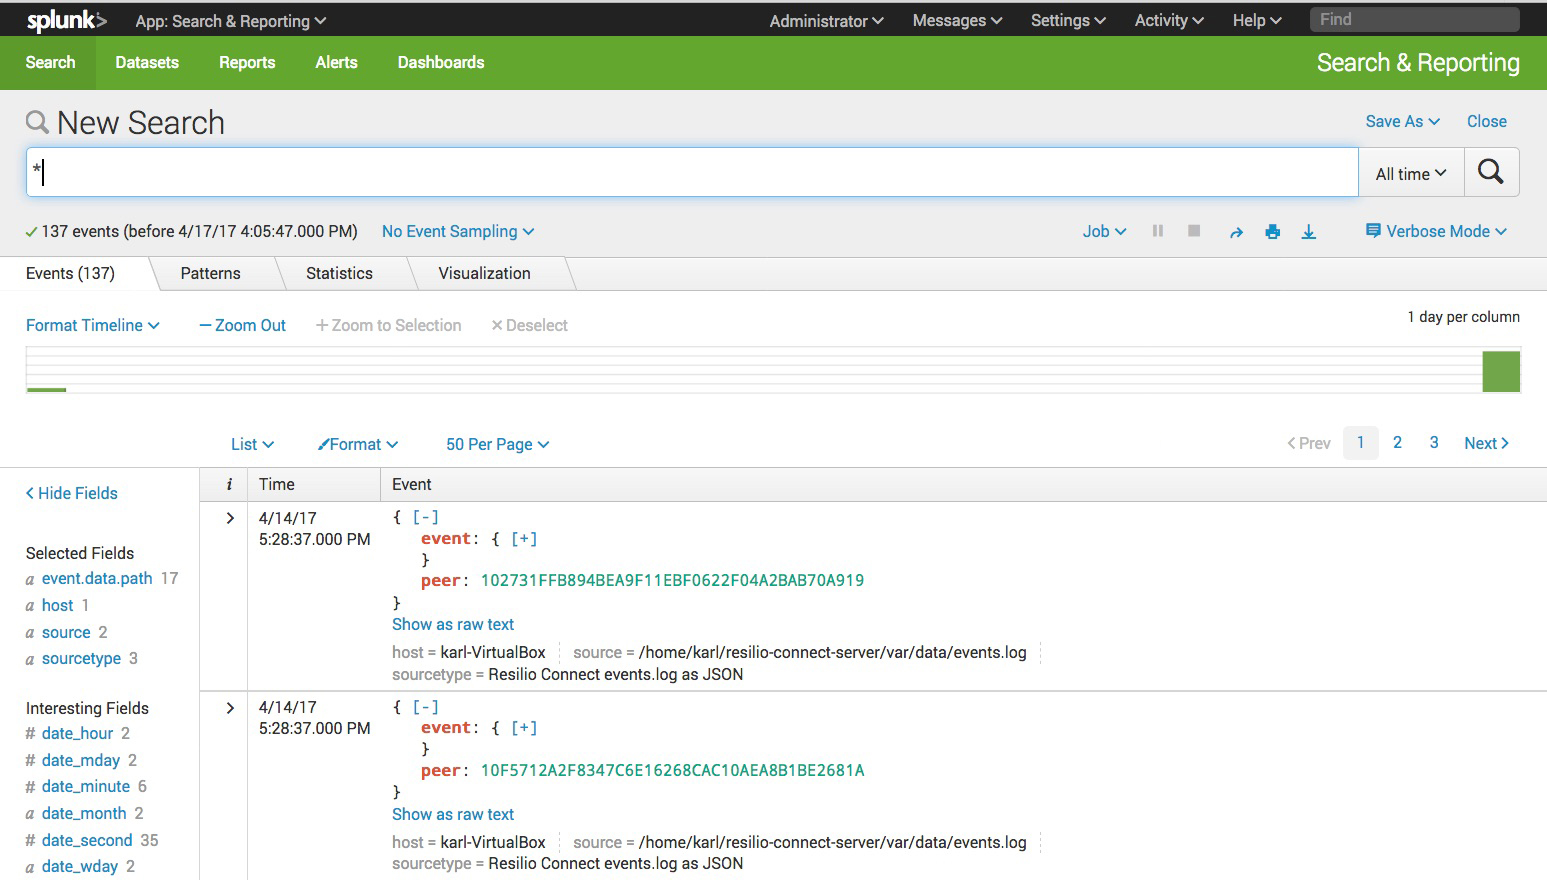
Once you are done, navigate to the Search app.
Helpful Tips
Here is a couple of useful searches in Splunk.
-
Find out which agents are done with some particular folder sync
(you'll need to replace ShareID in query with yours):
event.event_type="folder_receive_finish" event.data.share="<share_id>" | table event.ts peer -
Find out what was happening to a particular file
event.data.path="<your_filename>" | table event.ts peer event.event_type -
Find the history of actions of particular agent:
peer="<PeerID>" | table event.ts event.event_type event.data.path -
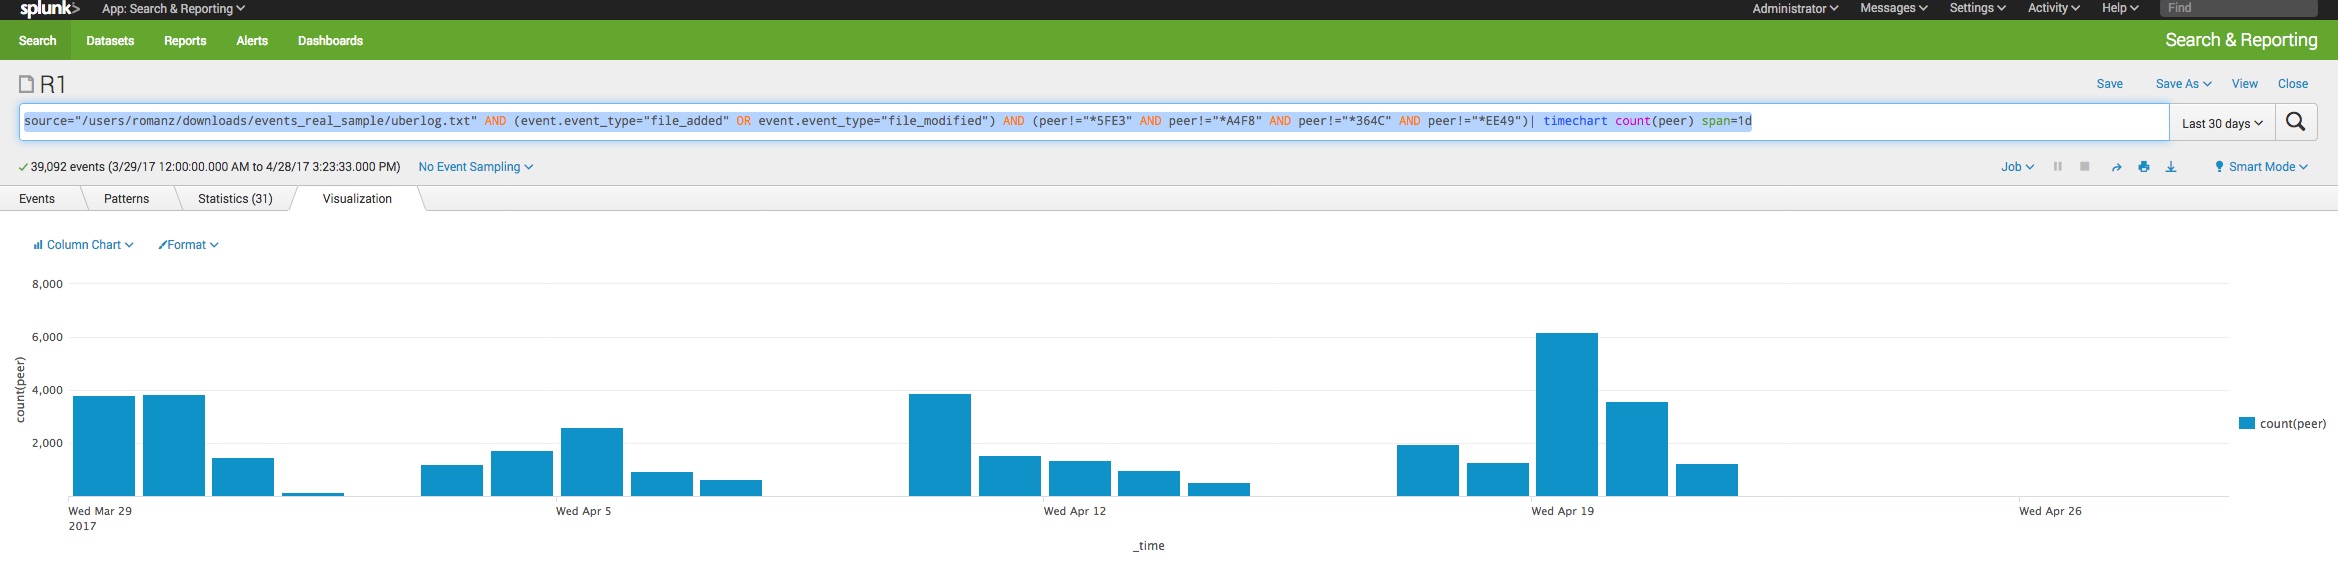
Track your users activity:
(event.event_type="file_added" OR event.event_type="file_modified") | timechart count(peer) span=1d
-
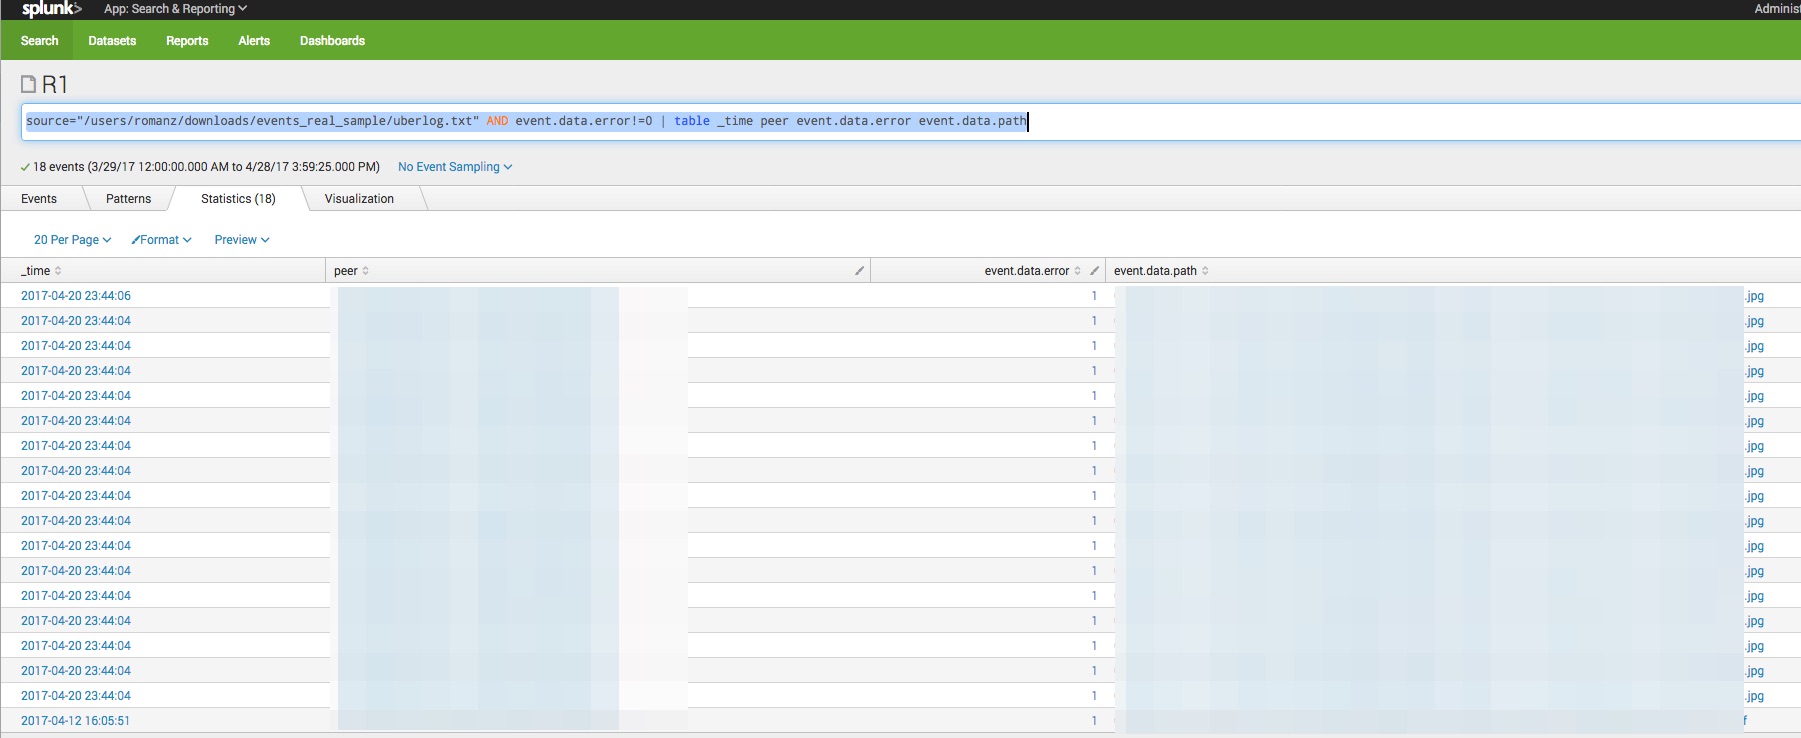
Find errors that are happening in your setup:
event.data.error!=0 | table _time peer event.data.error event.data.path
-
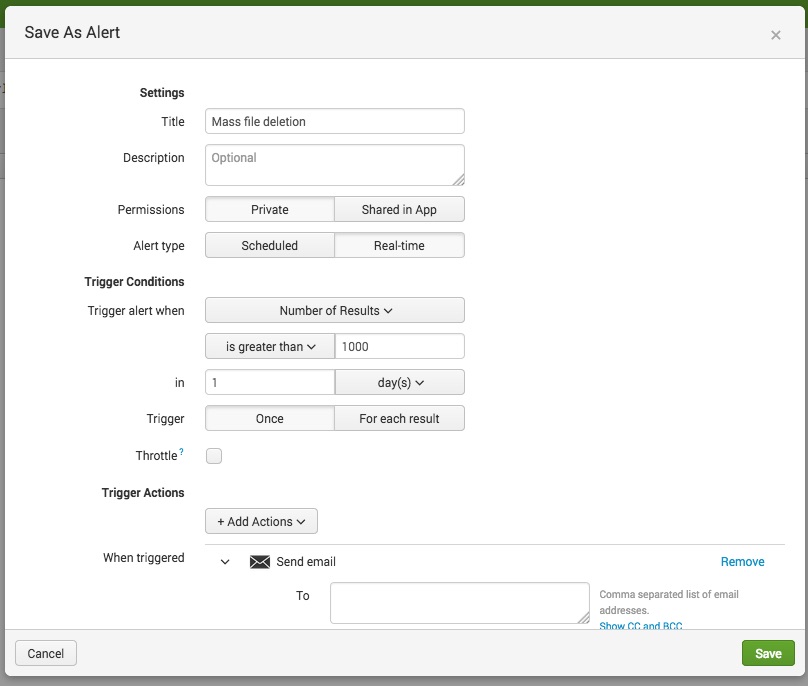
Track if any of your users have massively deleted files from a common share:
event.event_type="file_deleted" earliest=-24h latest=now
Configure the "Number of results" to value that is appropriate for your organization
-
Track real-time activity of some particular folder:
In this case, you'll be able to see the latest event reported by each peer for the selected folder. If you choose a real-time sliding window, Splunk will show you what happens in real-time:
event.data.share="<your_share_id>" | stats latest(event.event_type) as latest_event, latest(_time) as event_time_e by peer | convert ctime(event_time_e) AS event_time | table peer latest_event event_time -
Measuring your data delivery latency:
Use next query to see your data delivery latency (i.e. the time from the moment when peer detects a new / changed file to the moment when any peer gets this updated data).
event.data.share="<your_share_id>" | transaction event.data.hash startswith=eval('event.event_type'=="file_added" OR 'event.event_type'=="file_modified") endswith=eval('event.event_type'=="file_received") maxevents=-1 | table _time duration